Real-Time Signal Scanner — Now Live
Find every trade.
Before it moves.
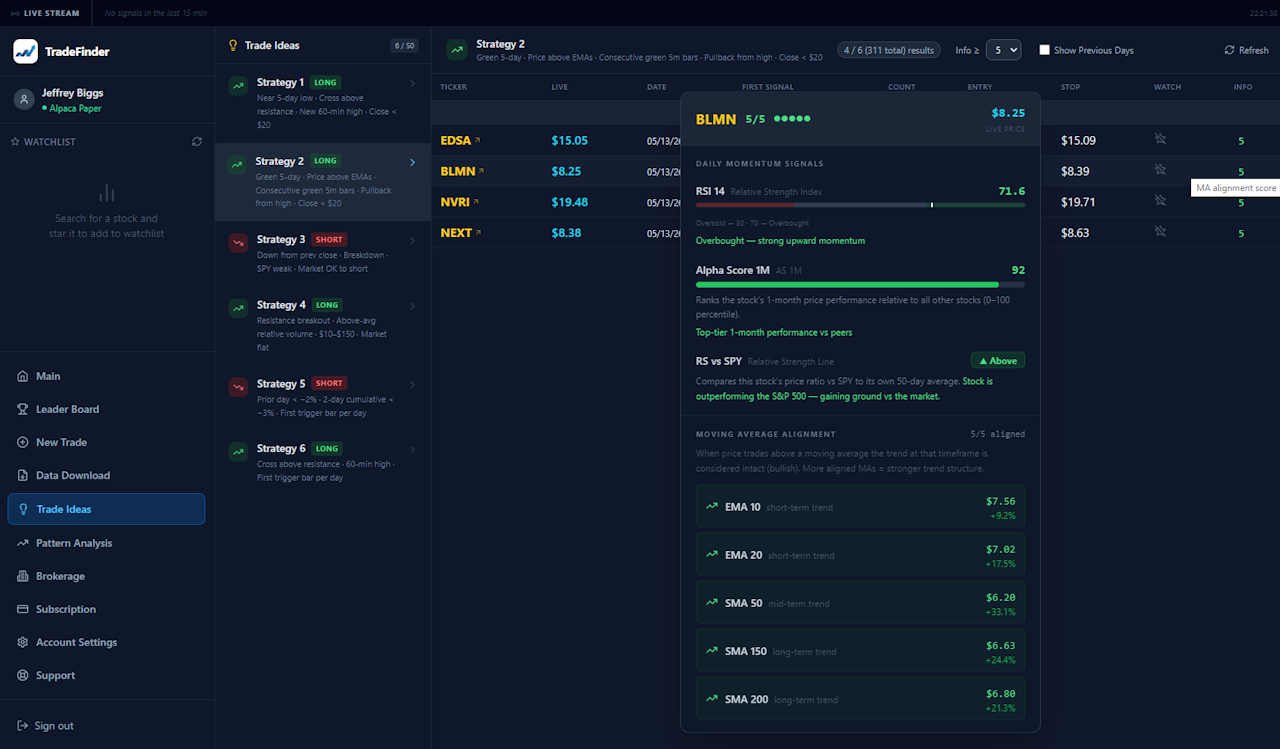
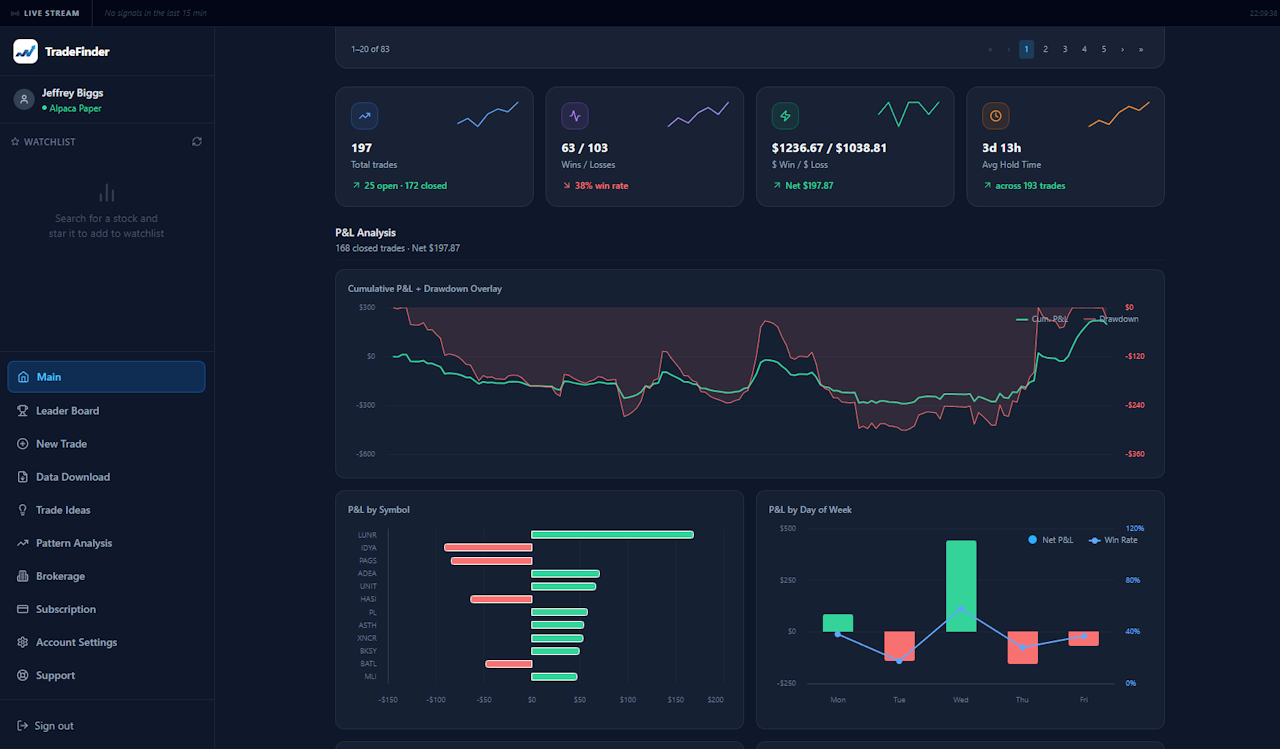
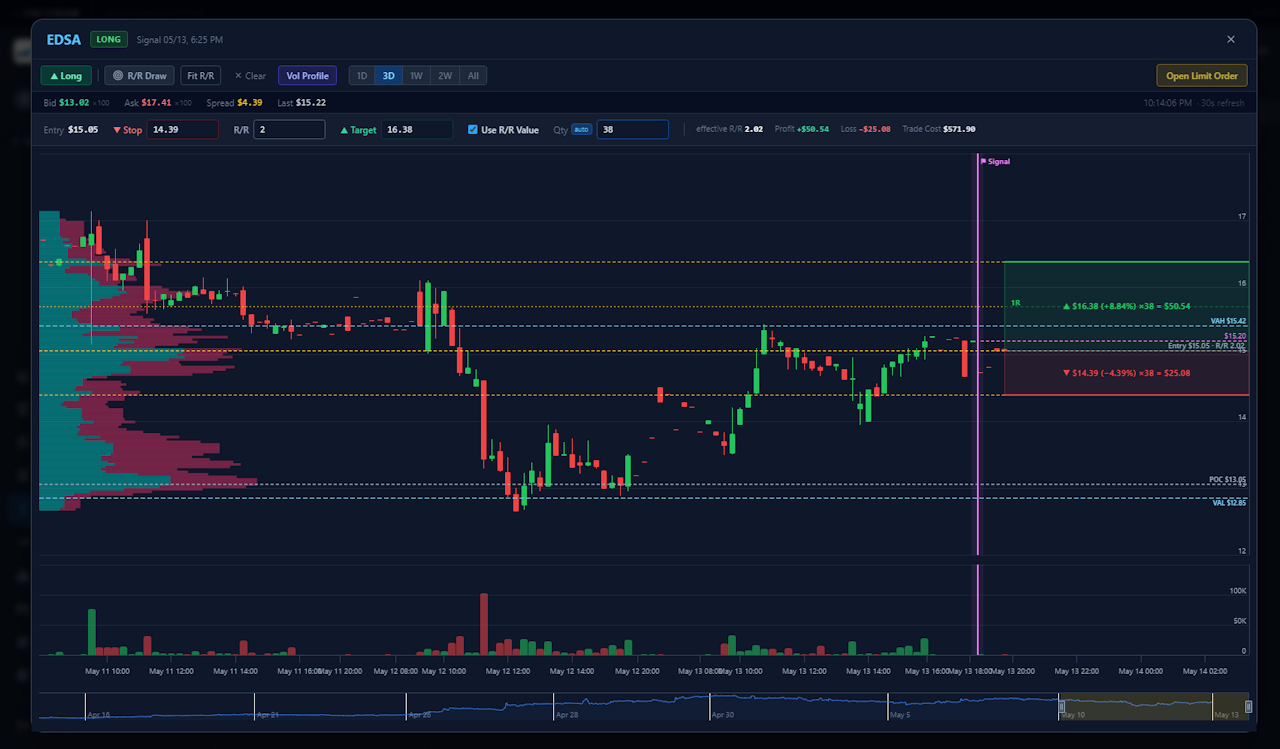
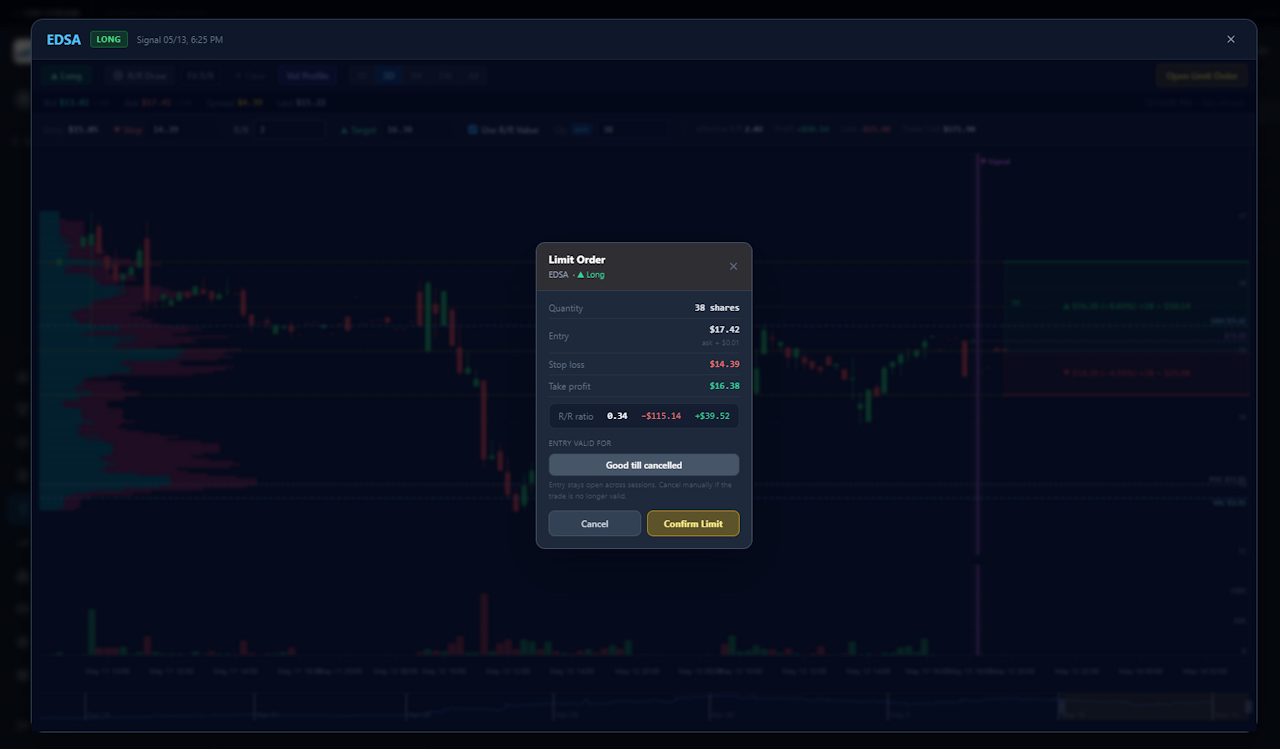
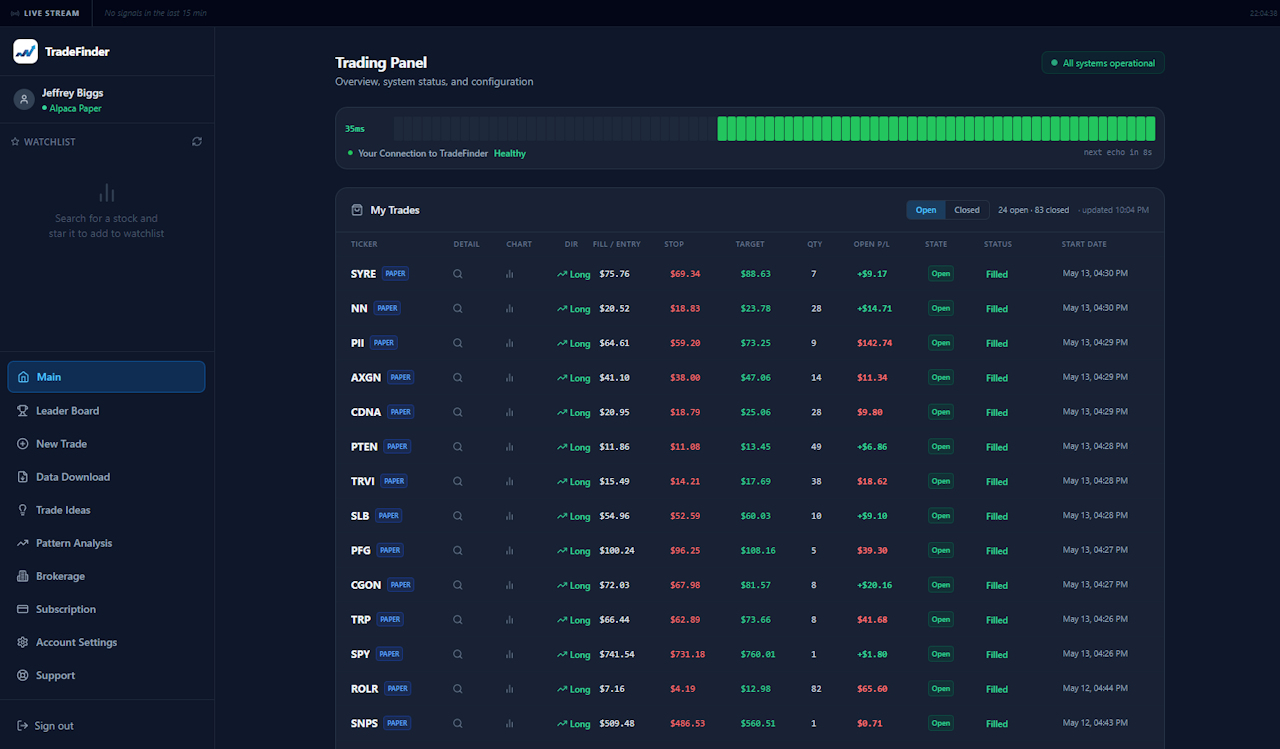
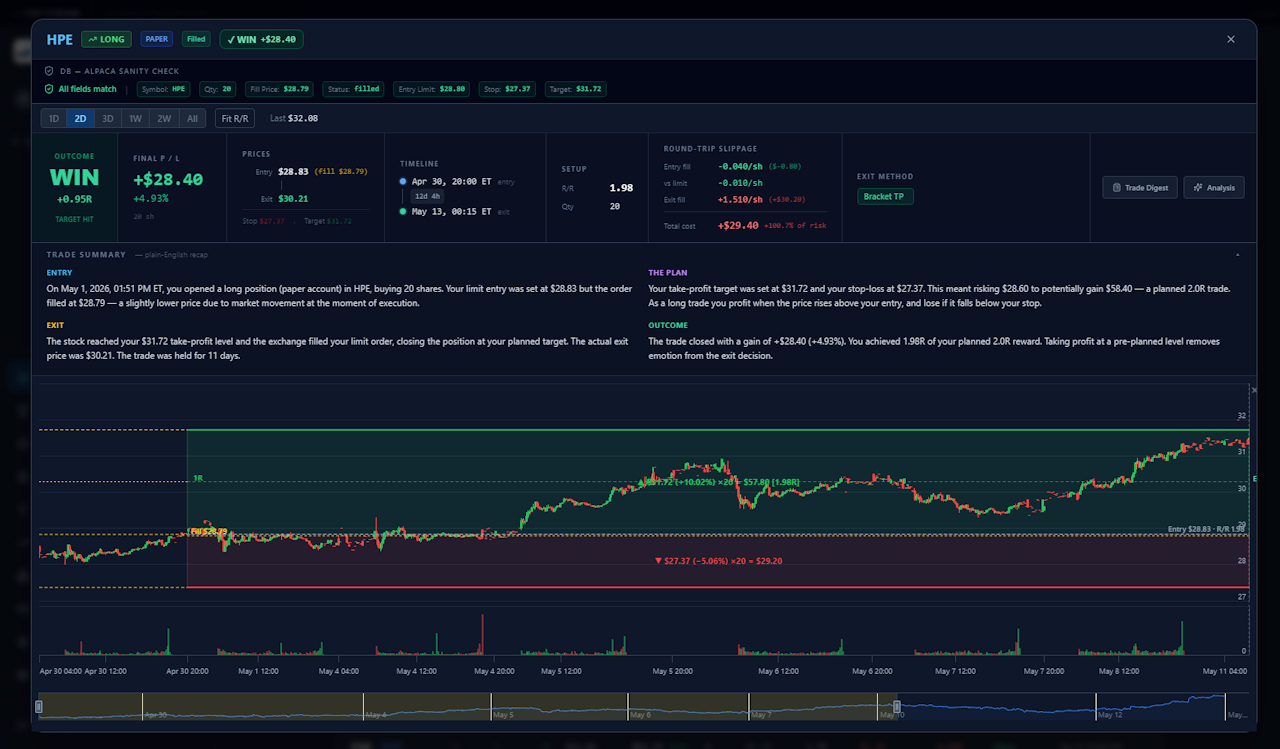
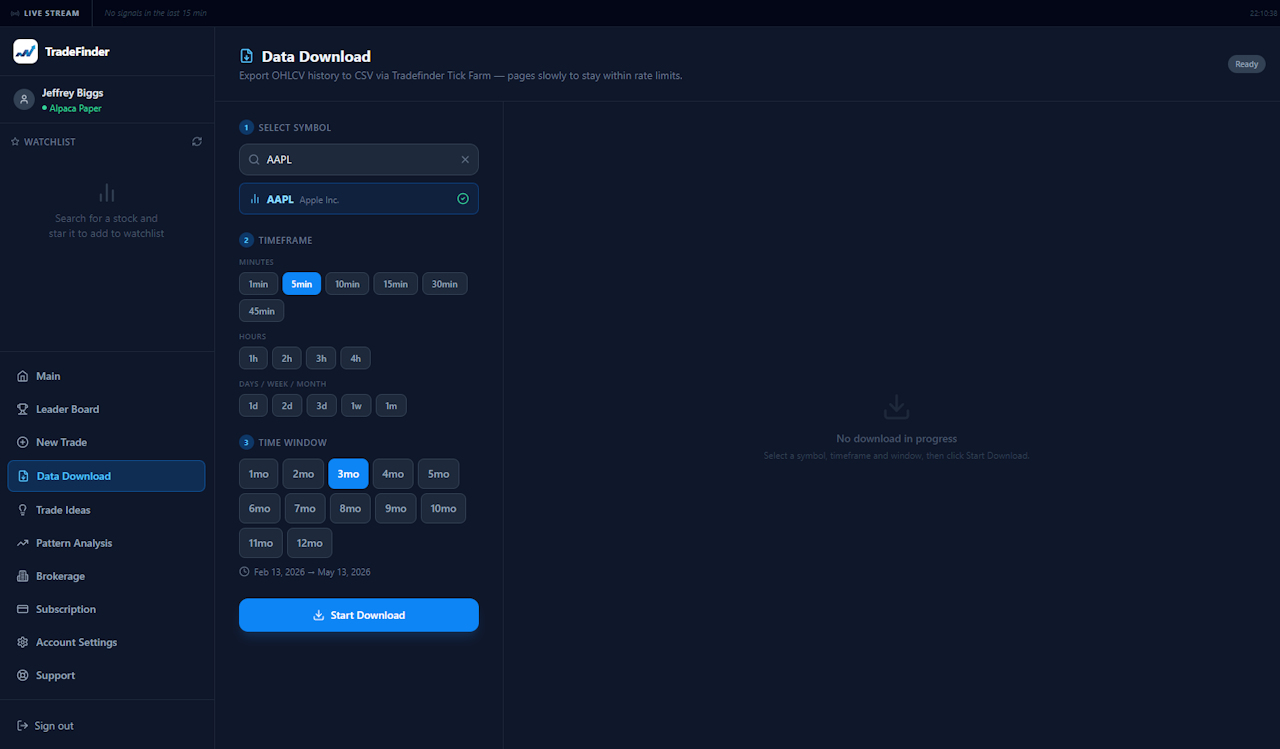
TradeFinder is a professional desktop trading platform that scans the market in real time, surfaces high-probability setups across 6 proven strategies, and manages your bracket orders — all in one workspace.
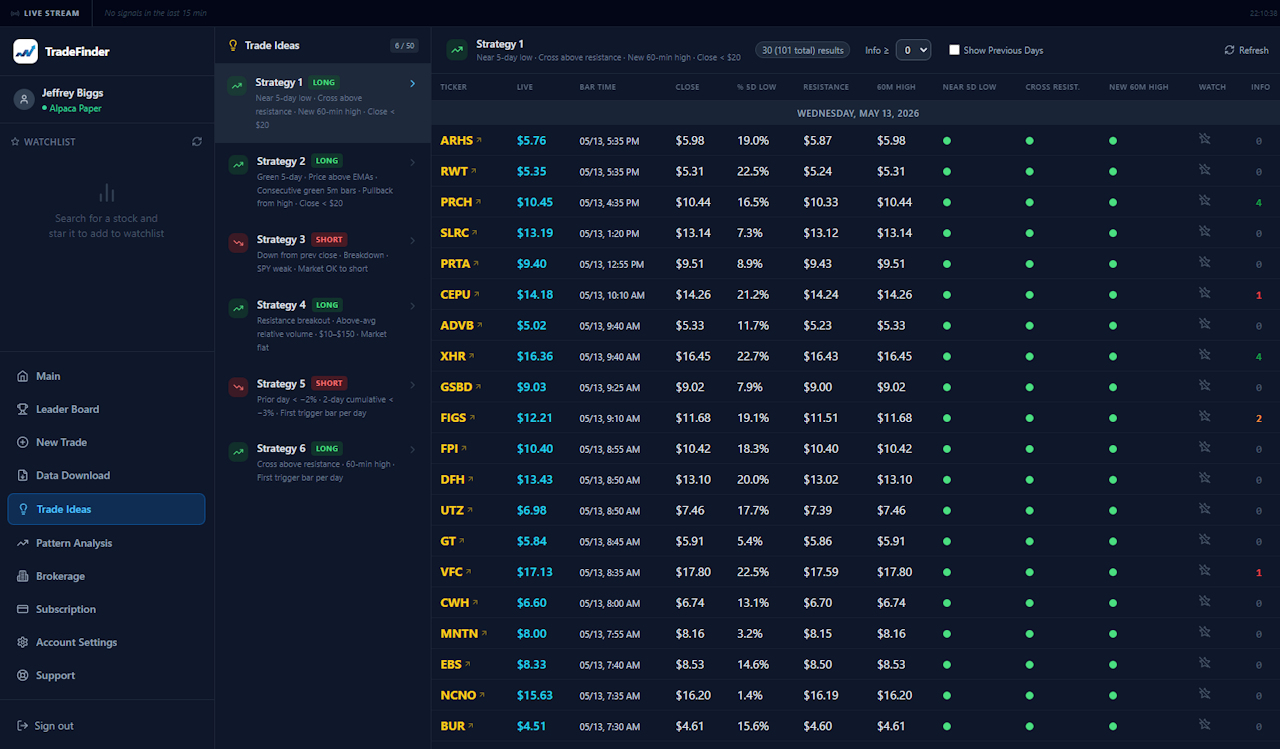
Today's signals
101 setups found
Live connection
All systems go